Here you can find an overview of some of the academic publications and projects I worked on between 2011 and 2018. Stay tuned for more updates!
Publications
For a list of my publications, please see my profile on Google scholar.
Recent projects
During my time as a postdoctoral researcher in biomedical text mining, my research combined supervised machine learning approaches with unsupervised, co-occurrence based techniques to infer associations between genes, proteins, chemicals, or diseases.
CoCoScore

We developed CoCoScore, a context-aware co-occurrence scoring scheme for text mining applications. CoCoScore is available on GitHub. Please open an issue, send a pull request, or contact us via mail in case you have feedback.
Previous projects
As part of my PhD studies at the Center for non-coding RNA in Technology and Health (RTH), University of Copenhagen, Denmark, I worked on the following projects. My thesis supervisor was Jan Gorodkin.
Integrating RNA and protein interactions
In this project we are developing a database called RAIN (RNA–protein Association and Interaction Networks). The project goal is to collect RNA–RNA and RNA–protein interactions from a diverse range of sources: we a) search interactions by text mining abstracts of millions of scientific papers, b) collect experimentally validated interactions of non-coding RNAs from various databases, c) predict miRNA–targets using state of the art prediction algorithms, and d) collect curated knowledge from biological textbooks. We then integrate these sources of evidence and assign an easily interpretable confidence score to each interaction. This integrative scoring allows users to decide whether to trust a given interaction or not.
The integration of RAIN with the popular STRING database enables us to visualize both RNA and protein interaction networks in a single, easily accessible user interface:
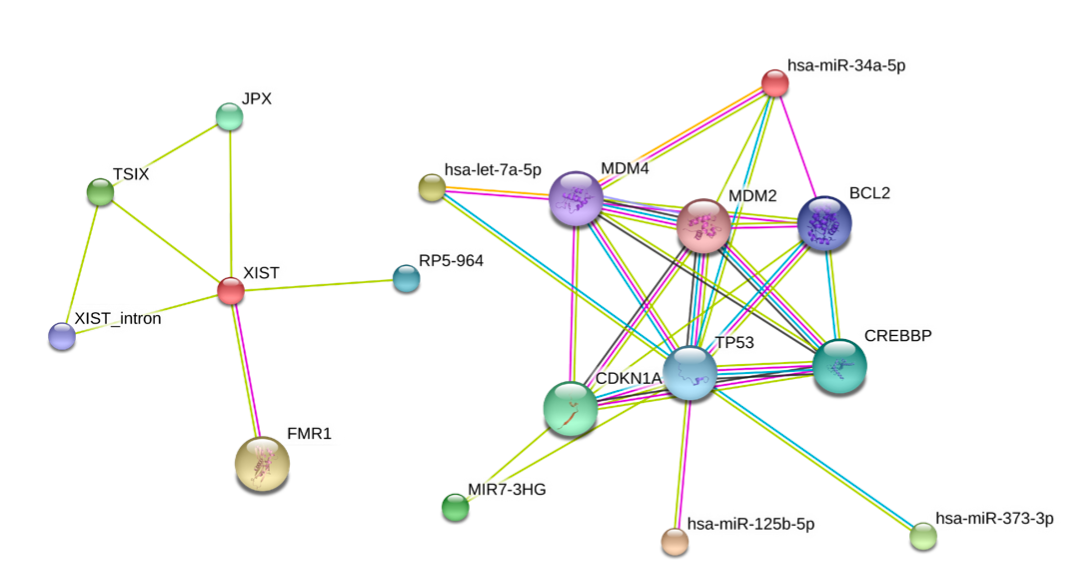
This project is a collaboration between four research institutes in Denmark and one in Switzerland.
Relevant publication: https://doi.org/10.1093/database/baw167
Clustering of RNA secondary structures
Besides being translated into proteins, RNA molecules fulfill many biological functions ranging from the regulation of gene expression to genomic defense mechanisms. The secondary structure of RNA molecules is often crucial to their function. We are developing an approach to identify similar RNA structures in large-scale data sets thus shedding light on potential functional relationships between RNAs. Our approach tries to take RNA secondary structure conserved across species into account in order to improve the clustering using a graph kernel-based approach depicted below.
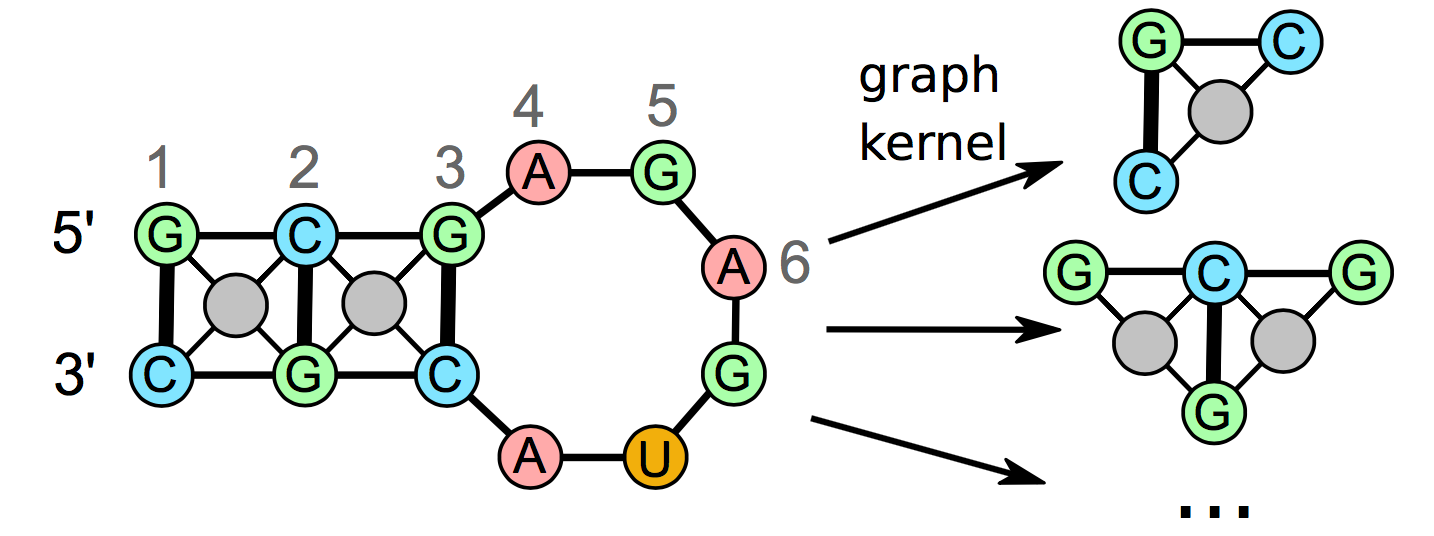
This project is a collaboration with the Bioinformatics Group at the University of Freiburg, Germany. The project website is available here. Furthermore, a short video (~1 min.) where I talk about our project is available (link to blog post).
Relevant publication: https://doi.org/10.1093/bioinformatics/btx114
Competitive endogenous RNAs in leukemia
Competitive endogenous RNAs (ceRNAs), also known as miRNA sponges, are RNA molecules that bind microRNAs thus titrating those microRNAs away from their normal targets. This phenomenon leads to a dysregulation of the fine-tuned gene expression levels in the cell. ceRNAs have been linked to breast or skin cancer development. We are researching into the role of miRNA sponges in leukemia.

This project is a collaboration with the The Granulocyte Research Laboratory at Rigshospitalet, the Danish State Hospital. This close collaboration between experimental and computational biology makes this project especially interesting to me.
Relevant publication: https://doi.org/10.1016/j.gene.2017.03.015
Active transitivity clustering
In my Master’s thesis project, I worked on an active clustering approach to transitivity clustering. Clustering of large data sets is hampered by a) storing the quadratic pairwise similarity matrix in main memory, and b) evaluating a potentially costly similarity function for each pair of objects. Active transitivity clustering circumvents both problems by actively deciding which pairwise similarities to compute and updating the clustering on the fly as new information becomes available. This saves both runtime and memory. The key workflow in active clustering is illustrated in the following flowchart:
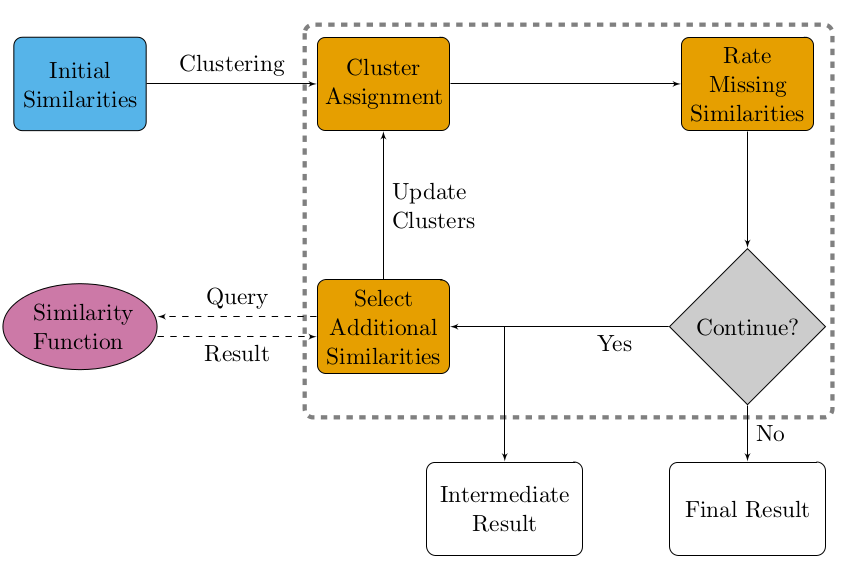
I worked on this project in the research group of Jan Baumbach at the University of Southern Denmark and formerly the Max-Planck Institute for Informatics. My thesis advisor was Richard Röttger.
KeyPathwayMiner
KeyPathwayMiner is a tool to identify parts of a given biological network that are dysregulated in a disease or condition of interest. We employ heuristic (ant colony optimization) and exact approaches to solve the underlying combinatorial optimization problem.
I contributed to the development of the KeyPathwayMiner 4.0 Cytoscape App with a focus on designing the graphical user interface. The publication is here. A sample of the KeyPathwayMiner 4.0 user interface is displayed below:
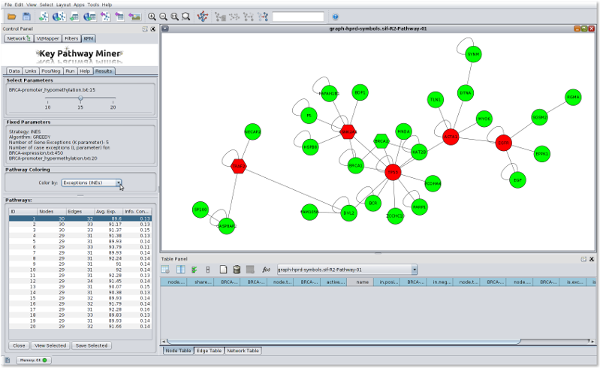
For more information about the project, please visit the KeyPathwayMiner website here: http://tomcat.compbio.sdu.dk/keypathwayminer/
Integrative clustering of cancer data
In my Bachelor’s thesis project, I identified tumor subtypes in data from The Cancer Genome Atlas based on genomic, epigenomic, and transcriptomic features using an integrative K-medoids clustering approach. Sample counts for each data type and their overlap is depicted in the following Venn diagram.
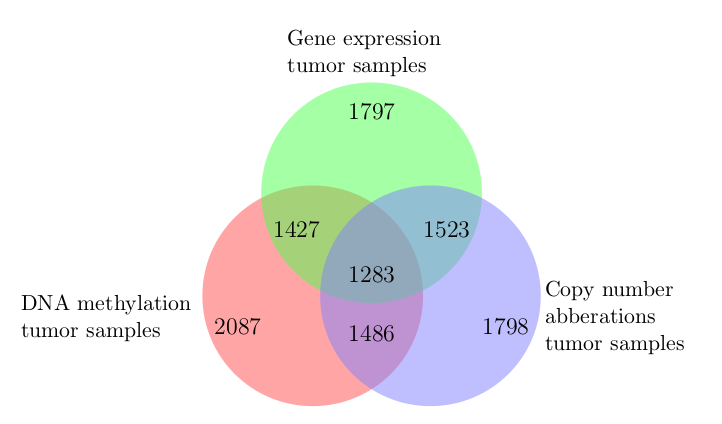
The project covered a total of seven cancer types. The four resulting clusters/subtypes of breast invasive carcinoma displayed differential promoter DNA methylation and gene expression levels of the BRCA2 tumor-suppressor gene. Two of the Glioblastoma multiforme (an aggressive form of brain cancer) subtypes included an enriched number of tumor samples harboring TP53 mutations.
I worked on this project in the research group of Thomas Lengauer at the Max-Planck Institute for Informatics. My thesis advisors were Yassen Assenov and Fabian Müller.
Pet projects
Quantified self
In 2016, I experimented with am tracking my activity (step count, heart rate, sleep duration, and more) using a Fitbit device. I wrote two blog posts, 1 and 2, about downloading, cleaning and visualizing these data. For instance, the following graph depicts the rolling mean of my daily step count over time.

Inspired by Bastian Greshake’s work, I plan to integrate my activity data with Google Maps location data to see, for instance, how the weather at my location influences my activity.


